Start Counting Cells in 3 Simple Steps
Mix equal parts of sample with 0.4% Trypan
Blue solution and pipette into a 10 ml Countess
slide or reusable slide.
 Enable 'Rapid Capture' from the main screen.
 Put the slider on the device until it clicks into place.

What are the advantages of automated cell counting?
- Accuracy—a highly accurate machine learning algorithm is applied to the cell count.
- Precision—auto lighting and autofocus minimize user input and variability.
- Speed—Quick capture and auto-save features create and save results faster.
- Convenience—built-in pre-dilution and cell division calculators, histograms and gating, and a results PDF report.
- Affordable price—both Countess 3 models are compatible with the Countess Reusable Slide.
The machine learning algorithm produces accurate counts; autofocus and auto illumination minimize user-to-user variability
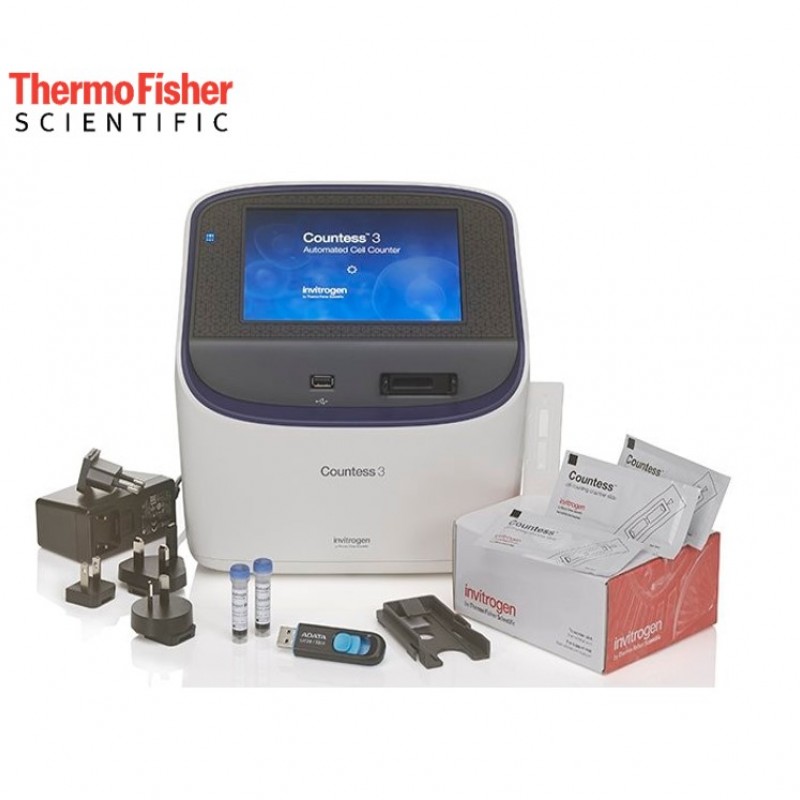
Countess™ 3 Automated Cell Counters use machine learning algorithms for fast and accurate focus determination as well as cell and viability counts. Countess instruments are compatible with a wide variety of cell types and have been validated for use with several commonly used cell lines and primary cell types. Once the slide is in place, the Countess device will automatically provide optimized illumination and focus on the cells, helping to minimize user variation associated with manual focus and lighting settings. Cells ranging in size from ~4 µm to 60 µm and cell suspension density ranging from 1 x 10⁴ to 1 x 10 7 cells/mL are ideal for counting.

Machine-learning algorithms result in highly accurate cell counts, comparable with flow cytometer counts. CHO-K1, HeLa, HEK293, Jurkat, and human PBMCs were counted using the Attune NxT Flow Cytometer (red bar), a Countess 3 FL Automated Cell Counter (blue bar), and manual counting using a hemocytometer and microscope (green bar). The Countess 3 FL Automated Cell Counter and hemocytometer bars represent an average of 6 counts. Error bars indicate standard deviation from 6 independent counts.

Machine-learning algorithms result in highly precise cell counts with lower variability between counts compared to manual counting. CHO-K1, HeLa, HEK293, Jurkat, and human PBMCs were counted using the Countess 3 FL Automated Cell Counter (blue dots) and manual counting using a hemocytometer and microscope (green dots). The lines represent the median count and the dots demonstrate variance from 6 individual counts.
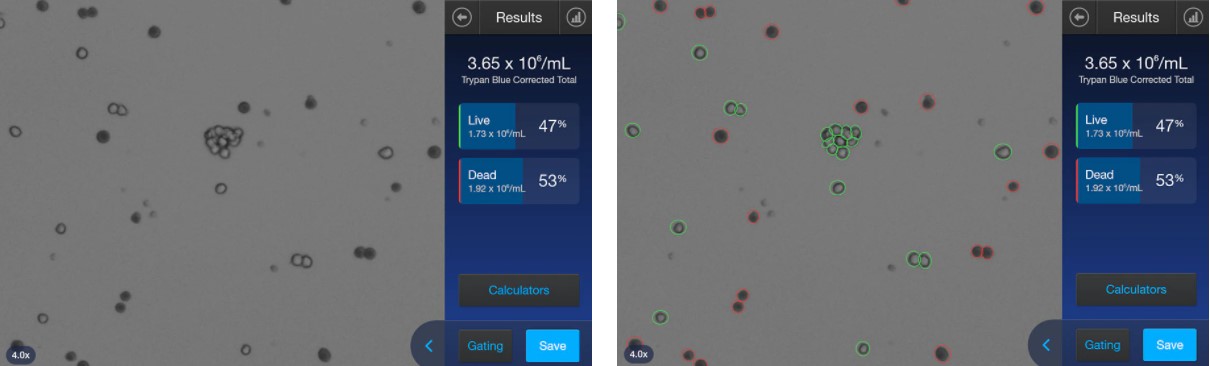
Countess 3 Automated Cell Counters can accurately count aggregated cells. Obtaining accurate cell counts from samples containing clumped cells can be difficult, whether you are currently using automated or manual cell counting methods. Samples containing debris further complicate cell counting. Countess 3 Auto Cell Counter automatically excludes debris from cell counts. Countess Automated Cell Counter's machine learning algorithm can clearly identify cell boundaries within cell clusters and ignore debris, providing highly accurate cell counts.
Small Cell Count
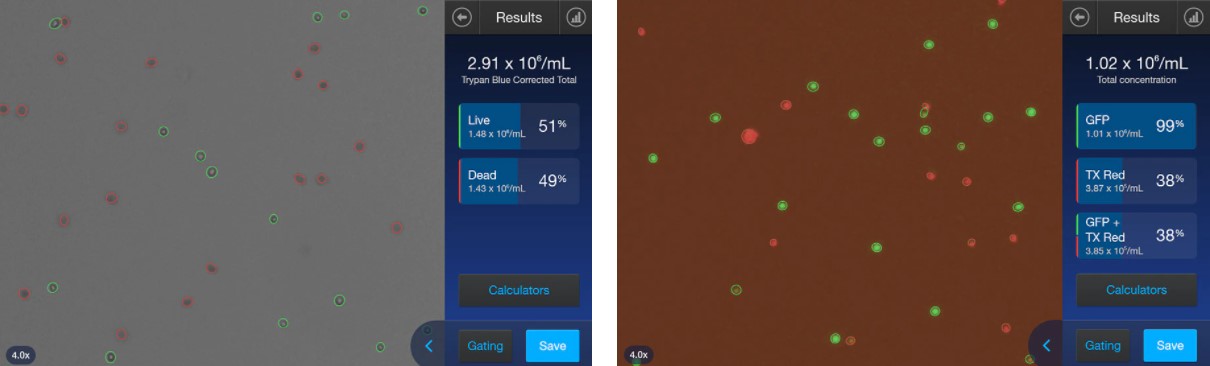
Rodent PBMCs are small cells around 5-7 microns and can be challenging to count whether manually on a hemocytometer or on an automated cell counter. The Countess 3 Automated Cell Counter’s machine-learning algorithm is robust and accurately counts these cells in both brightfield and fluorescence modes
Streamlined Process
There is always a lot of work waiting for scientists in the laboratory. The Countess™ 3 Automated Cell Counter simplifies the cell counting process. There are a few tedious steps required to work with manual cell counting. The Countess™ 3 Automated Cell Counter eliminates many of these steps and the hands-on time to perform them. This additional time can be applied to other activities in the laboratory, providing a significant advantage in switching from manual cell counting to automated cell counting.
Countess SAE Software Solution for 21 CFR Part 11 Compliance Support
To implement the Countess SAE Software Solution to support the technical 21 CFR Part 11 compliance portion on the Countess 3 and Countess 3 FL Automated Cell Counters, the following components need to be installed, activated, and communicating with each other.
- SAE Software—used to configure the Security, Audit and Electronic-signature settings for Countess Automated Cell Counter. SAE software consists of the SAE Administrator Console (installed on a server with a static IP address) and SAE Application Profile.
- SAE License—Used to activate the SAE settings for the Countess Automated Cell Counter
- SAE Mode—Countess Automated Cell Counter software that is remotely connected with the SAE Administrator Console

Built-in pre-dilution and cell division calculators make all necessary calculations seamless and integrated into the cell counting process. Viewing histograms and additional desired cell counts in the Countess 3 cell counter is easy, and a printable PDF report of your results can be saved and printed.
Pre-dilution Calculator
If the cell sample is concentrated and a dilution is required prior to cell counting, the Countess 3 cell counter can quickly and easily calculate the sample concentration. The Countess 3 cell counters can easily calculate or remove calculation of a 1:1 dilution with trypan blue.

Easily Gate Cells and View Histograms
Cells can be gated based on cell size, brightness, and circularity to fine-tune what is included or excluded for specific applications. View the histogram by selecting the graph icon and watch the changes in real time as you use the gating features. Using brightfield, the average cell size is aligned on the x-axis. Using fluorescence, the relative fluorescence units (RFU) is aligned on the x-axis.
 For more information please click.
 Loading...